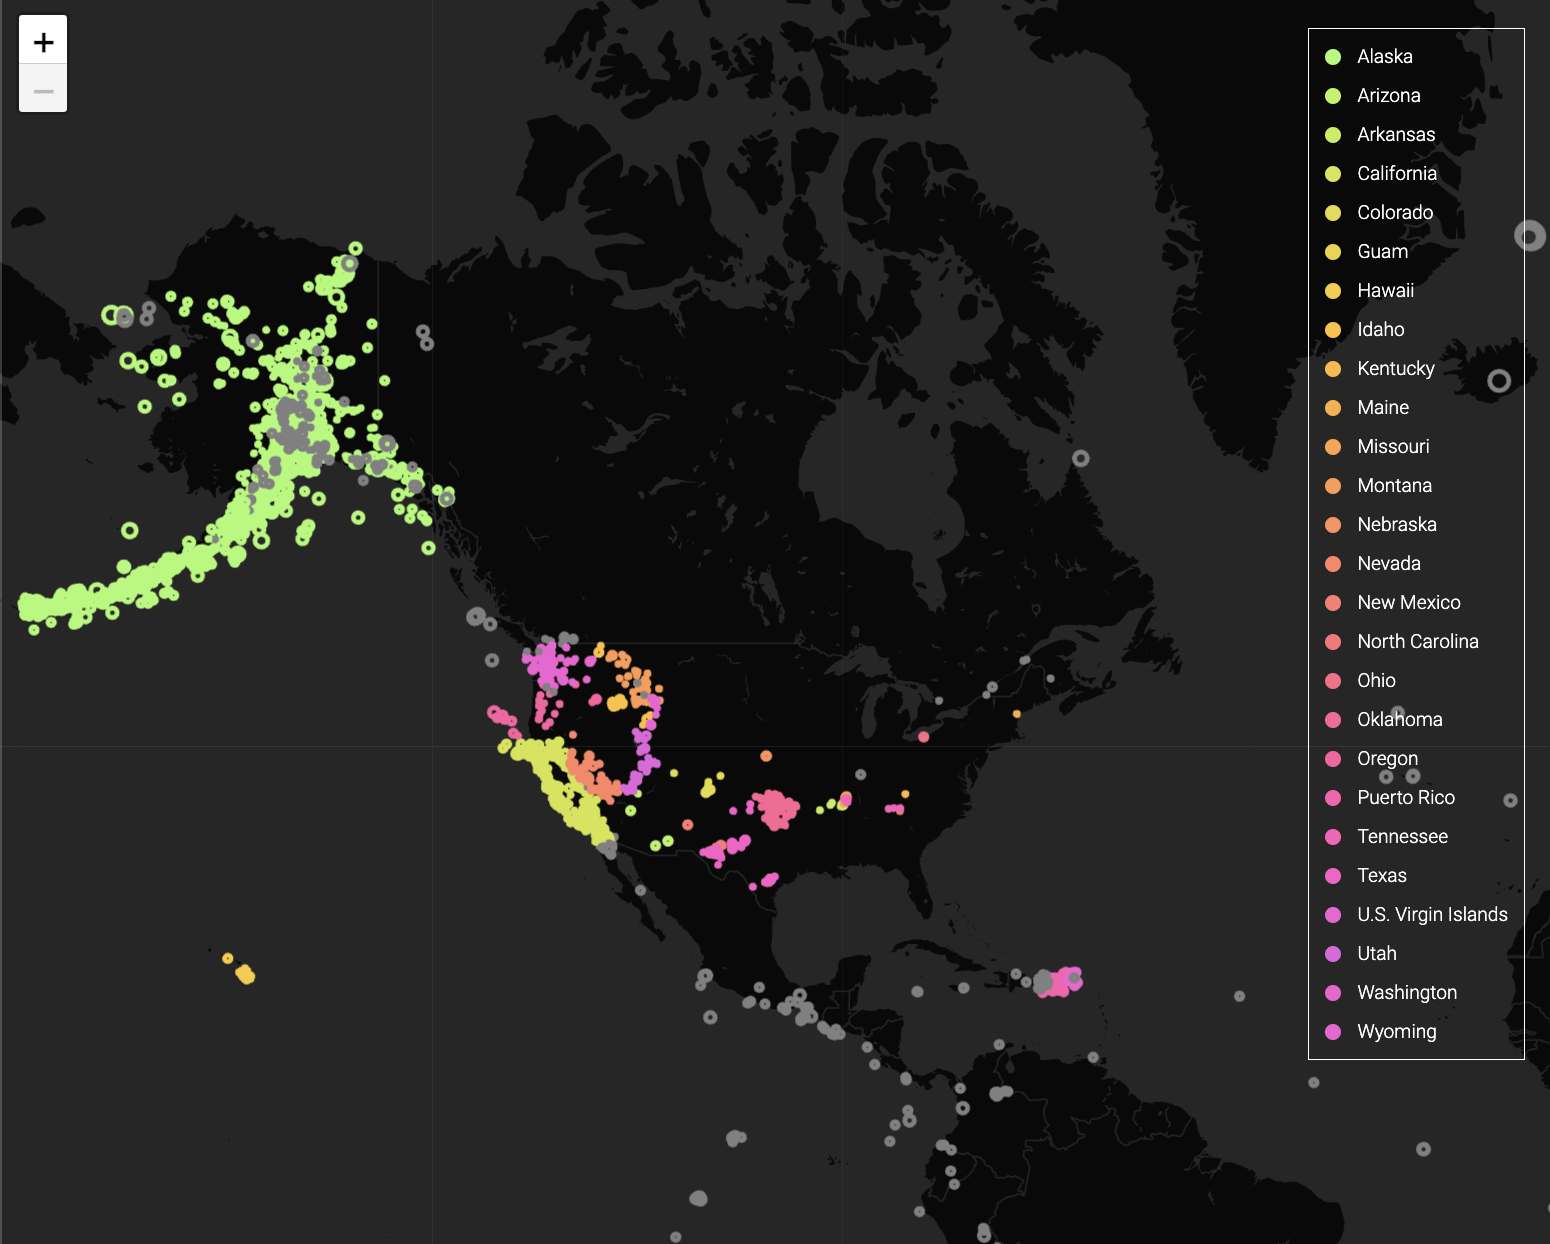
A map visualization of U.S. earthquake data
During the Fall 2023 semester, I created a map data visualization of earthquake data in the United States taking into account: geographical location and magnitude using p5.js, and leaflet.js JavaScript library.
The visualization takes data from USGS, filters data based on U.S territories, and arranges it on a leaflet map.

